
Resolving illumination issues caused by complex salt bodies has been a persistent geophysical challenge. DUG MP-FWI Imaging uses all parts of the scattered wavefield to reconstruct the reflectivity and kinematic Earth parameters. Naturally treating both up- and down-going wavefields, along with prismatic waves, multiples and ghosts as valuable information, guarantees significantly better subsurface sampling than primary-only imaging. This in turn delivers much-improved illumination, resolution and ultimately imaging of subsurface geology.
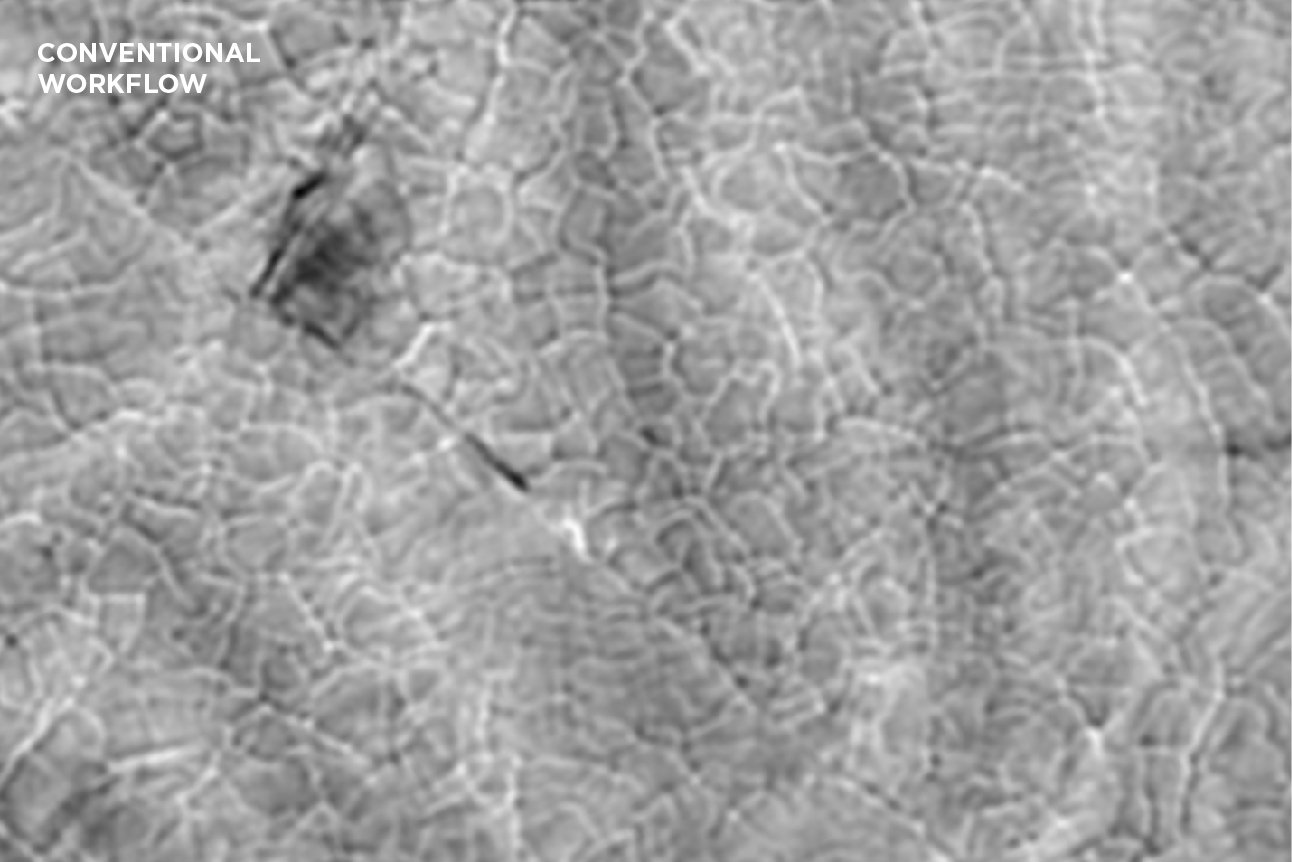
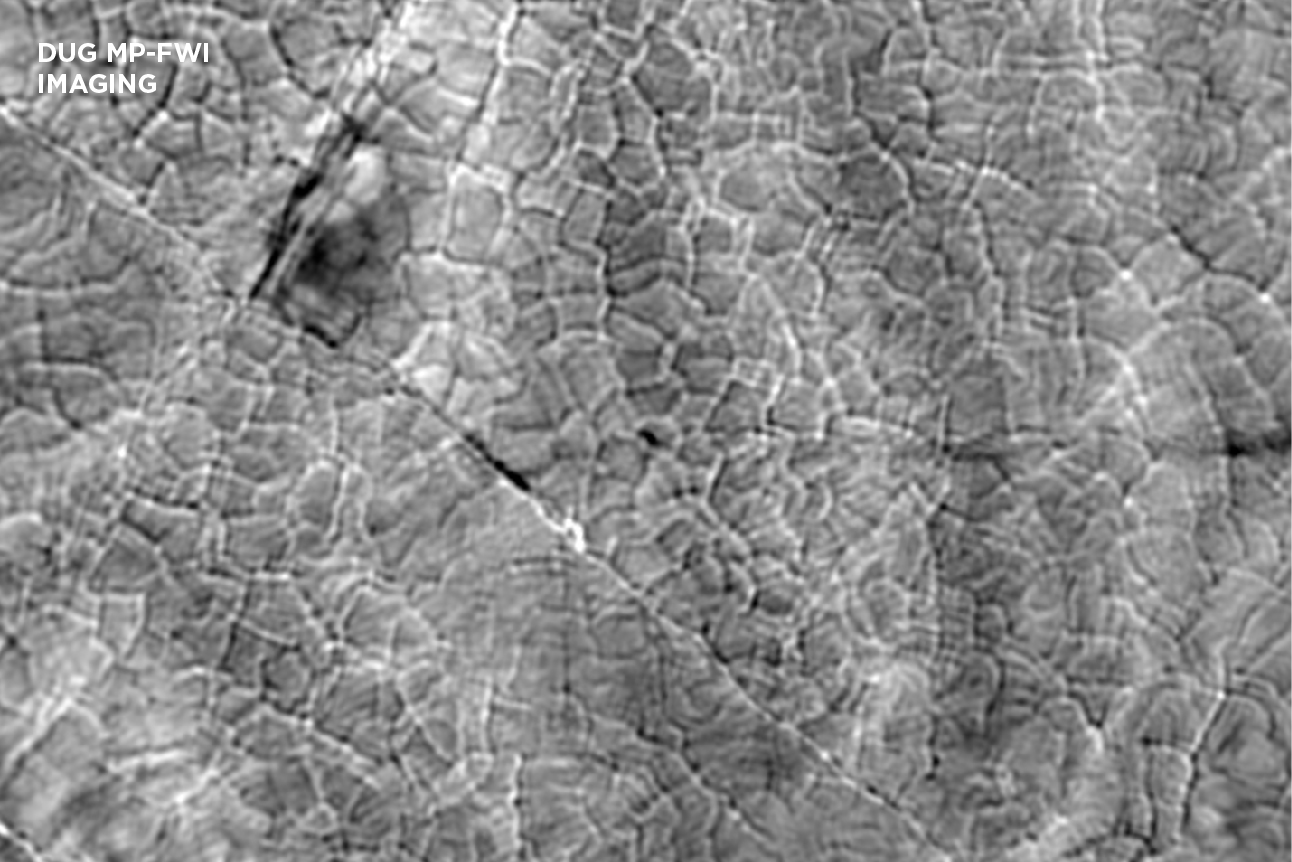
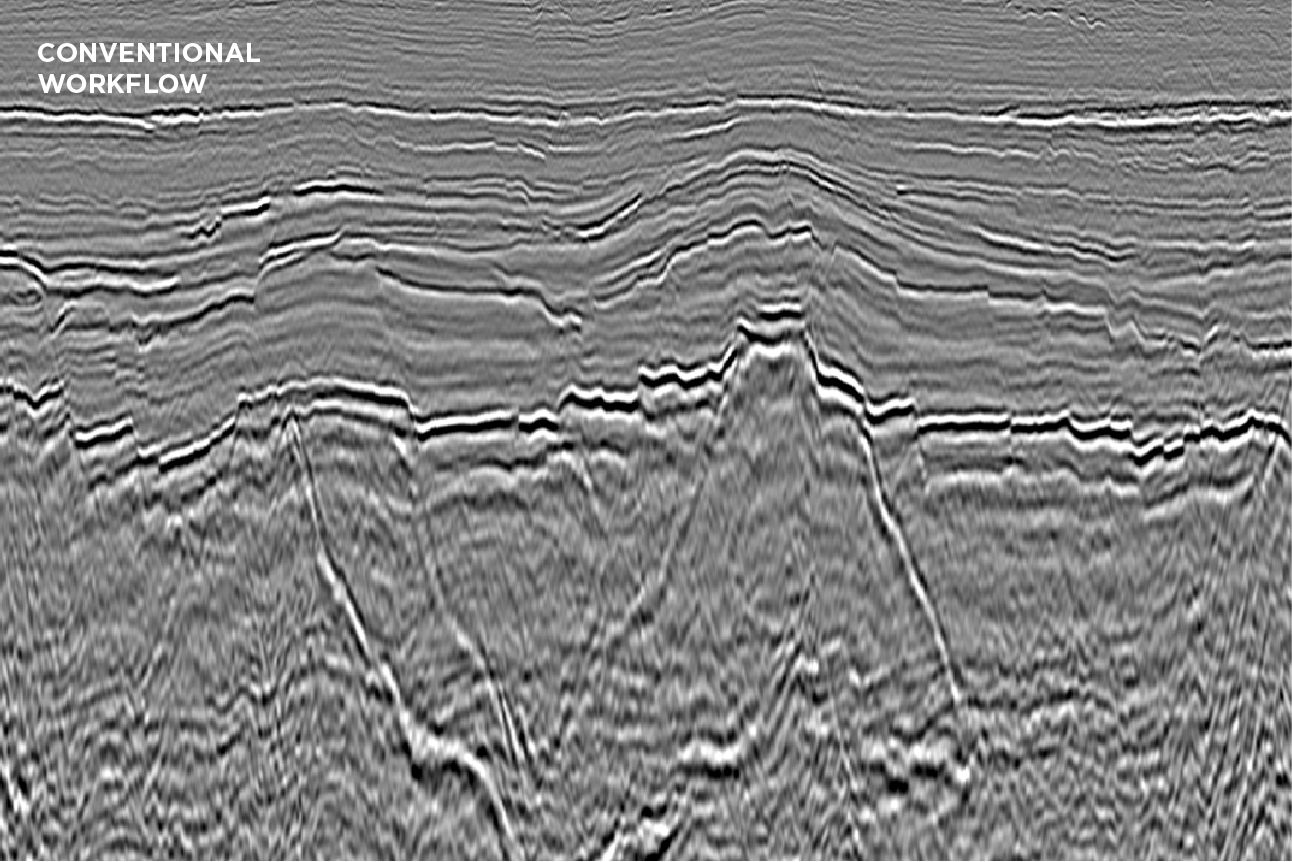
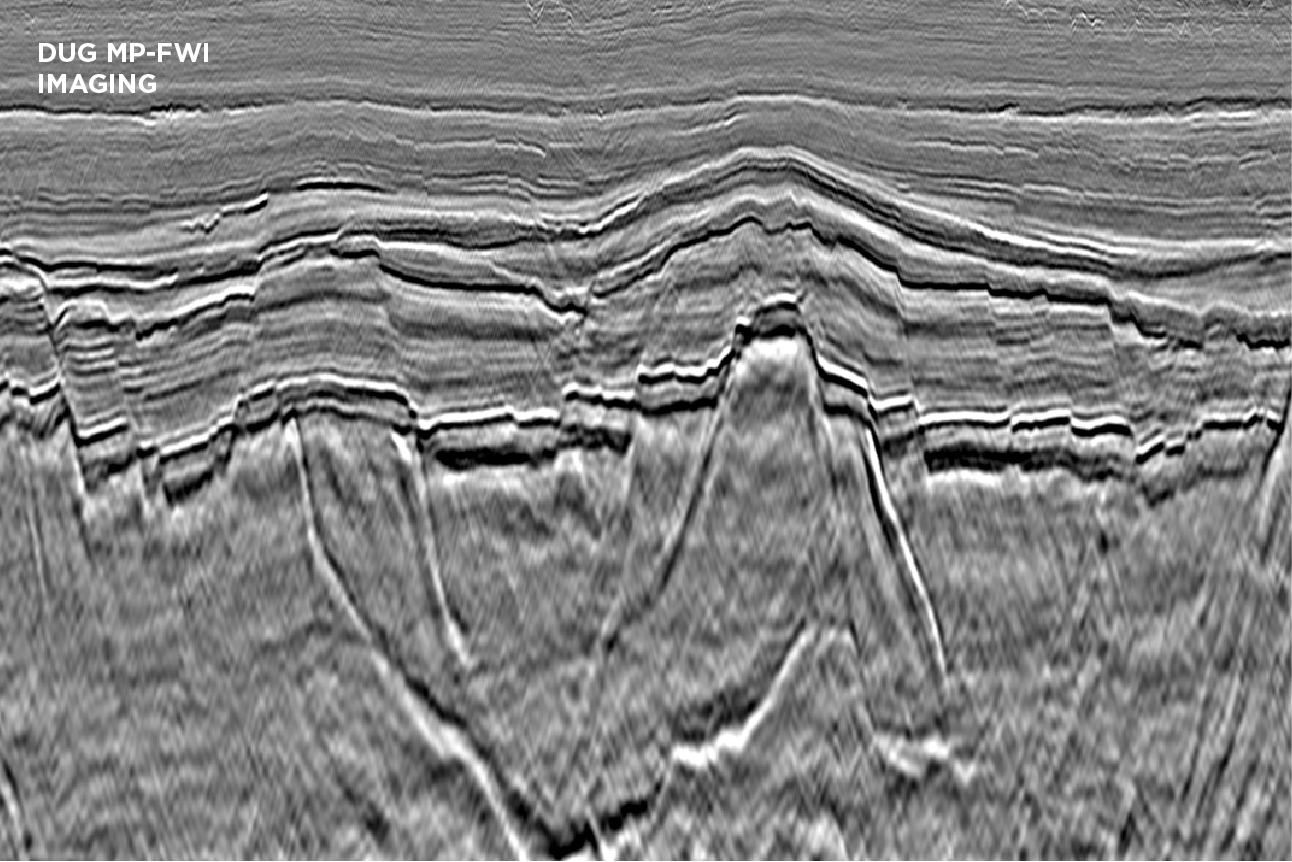
In these land dataset examples quite spectacular uplift was observed. DUG MP-FWI Imaging resolved subtle structural and stratigraphic features that were simply not imaged with a conventional processing and imaging workflow. Even with the additional complexity that comes with onshore data acquisition (such as topography and near-surface effects), DUG MP-FWI Imaging produced far superior results. Significantly better illumination and event continuity is obvious when comparing the sections below, thanks to least-squares imaging of the full wavefield—that includes interbed multiples. Incredible near-surface detail has been resolved, as can be seen on the shallow depth-slices to the right. This example highlights why DUG MP-FWI Imaging is now the technology of choice, and a must-have for any seismic project, either land or marine.
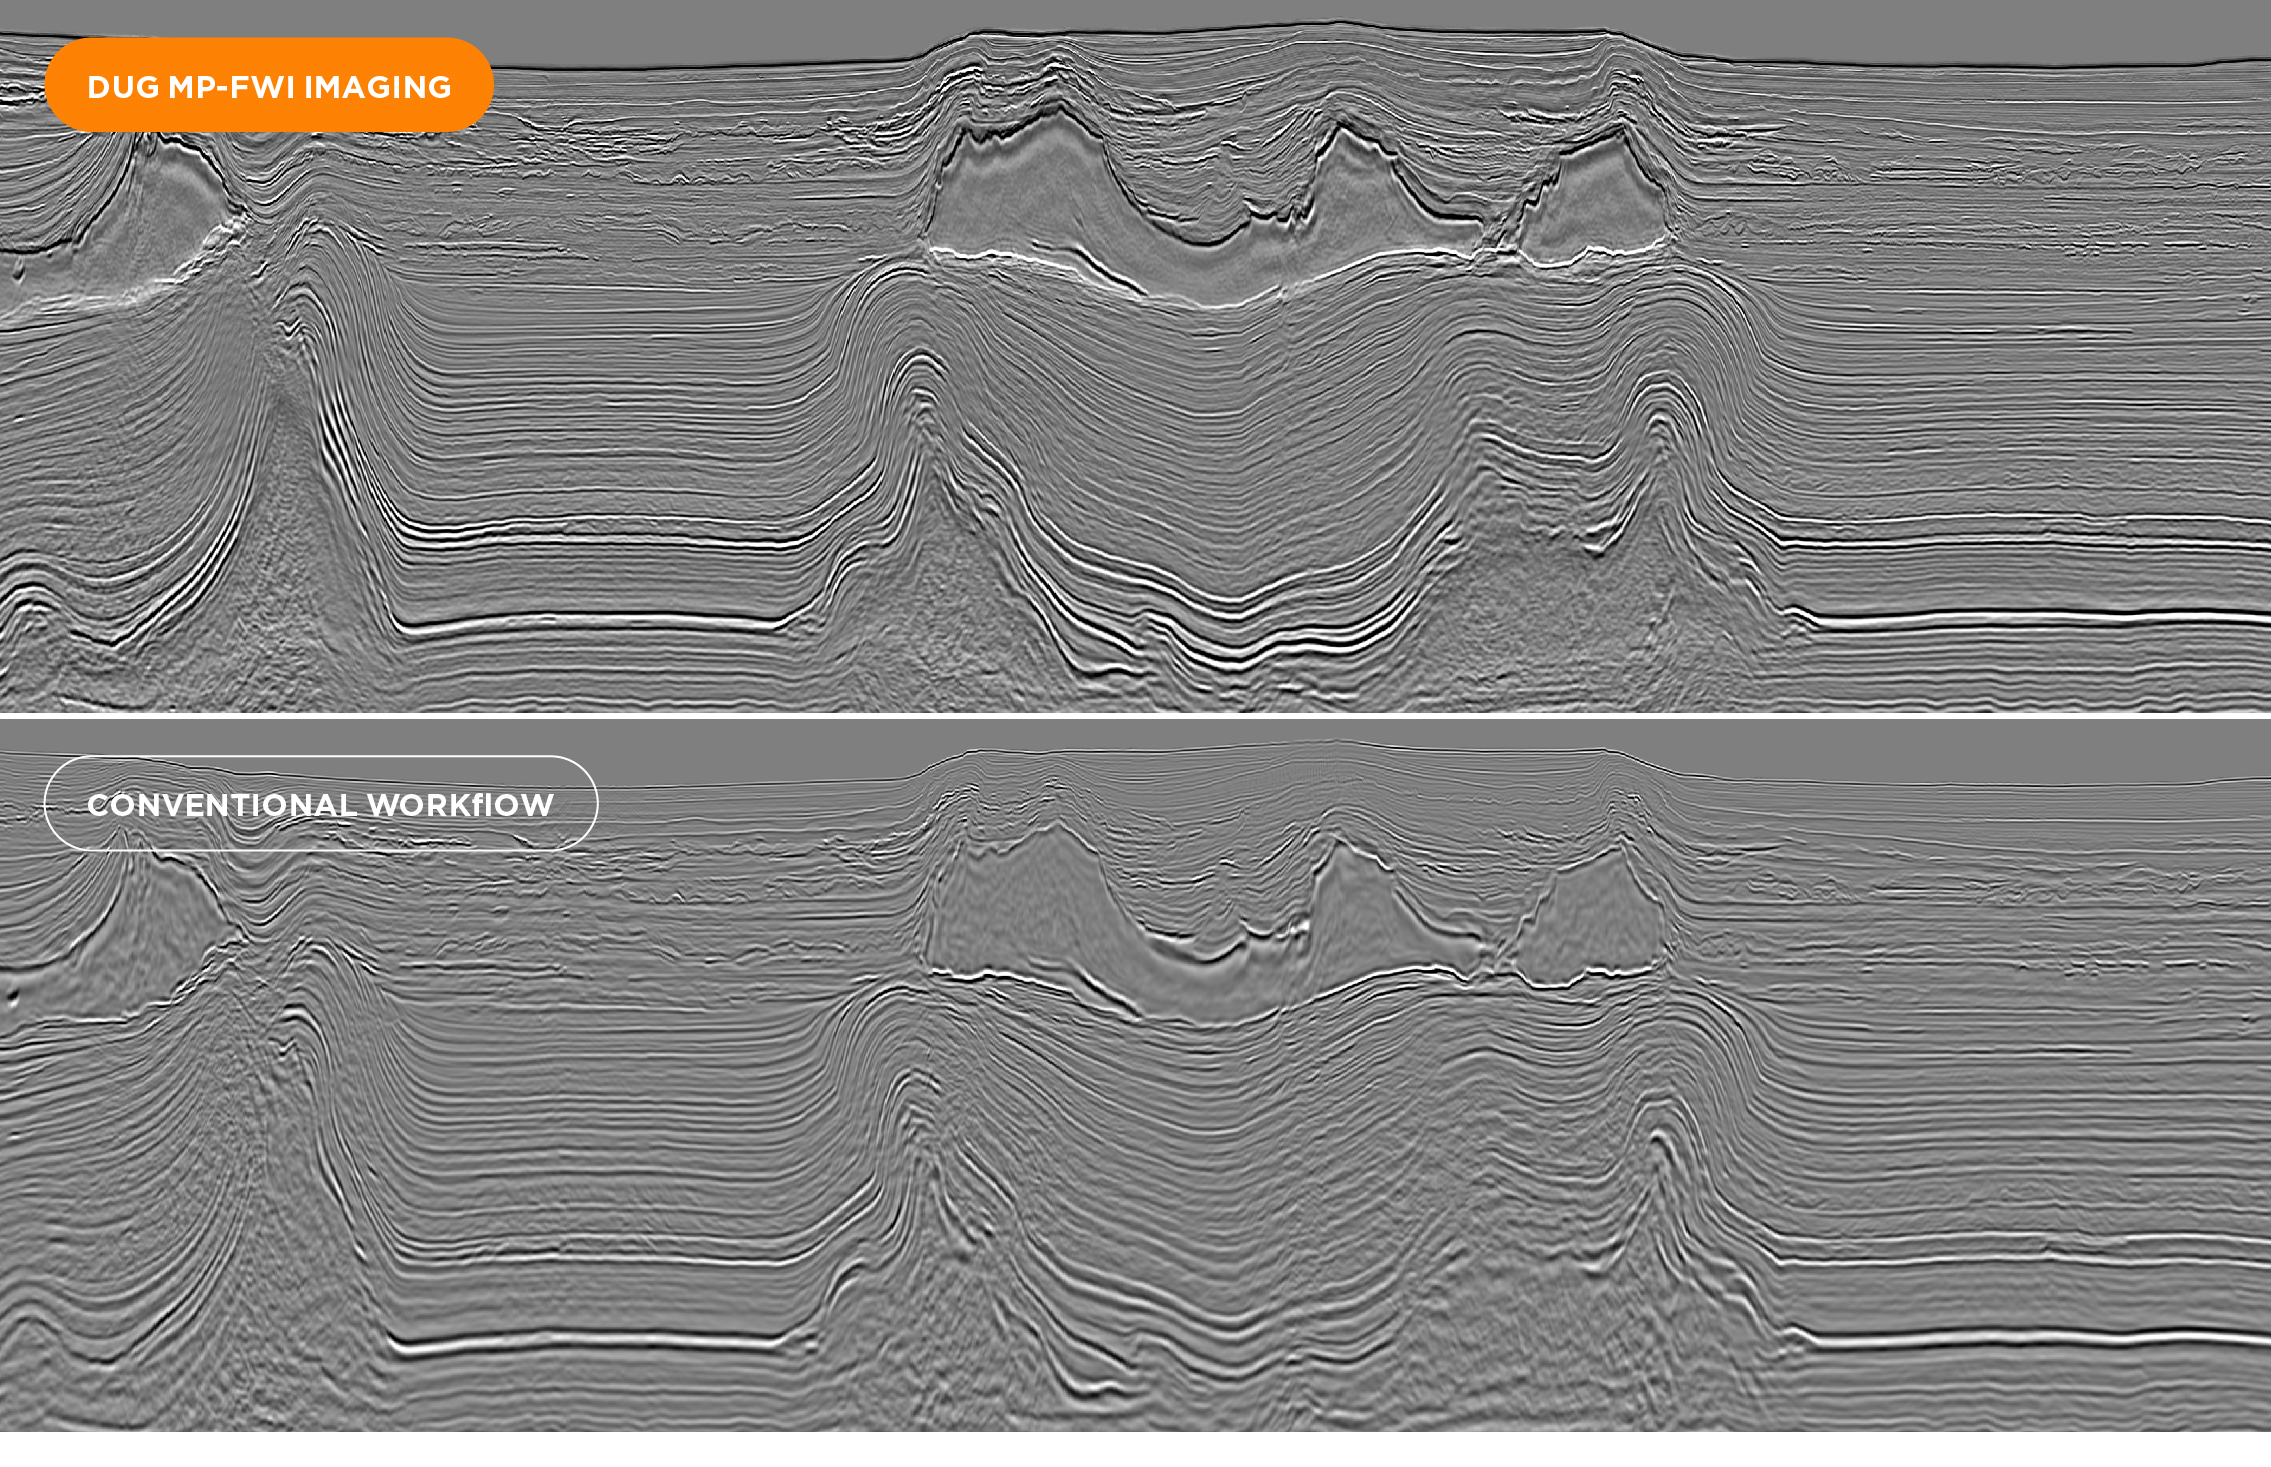
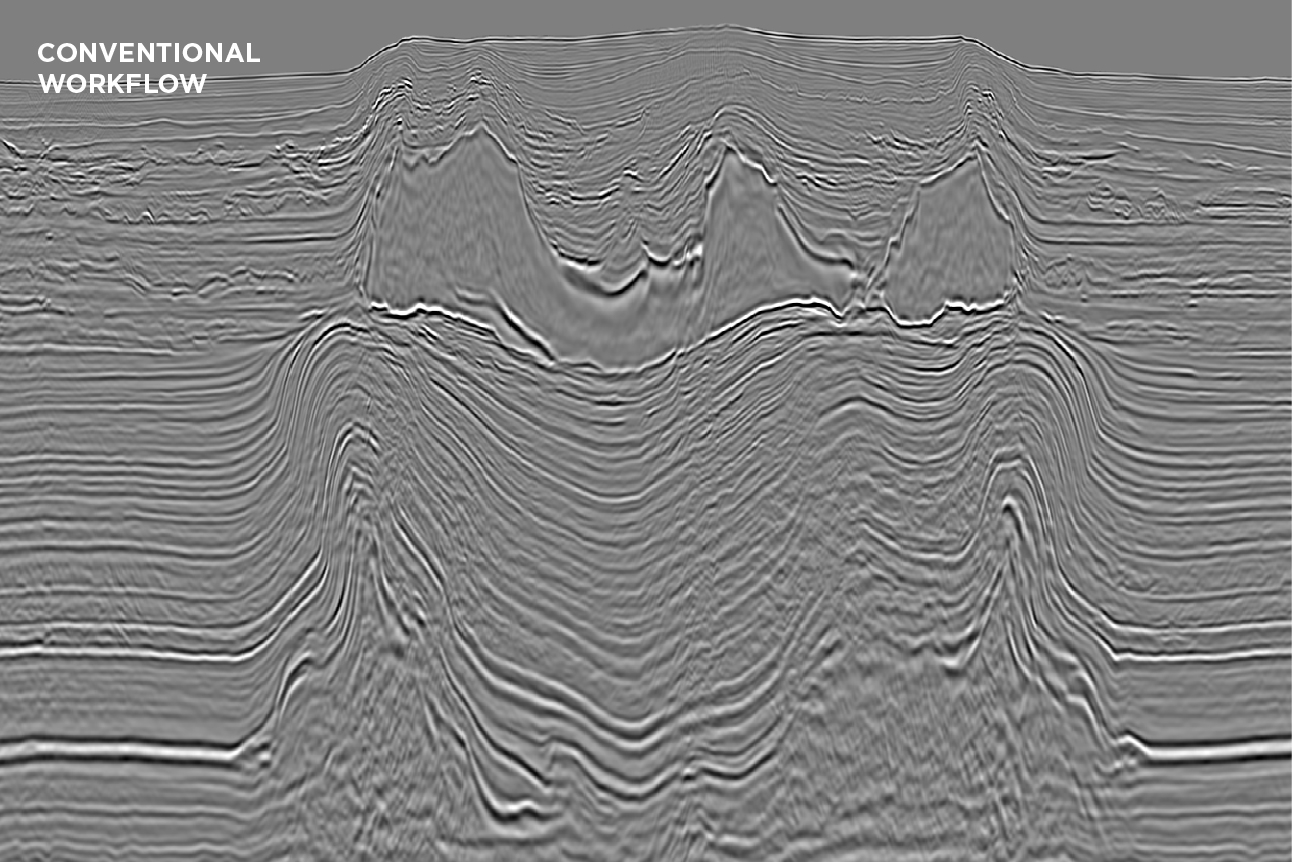
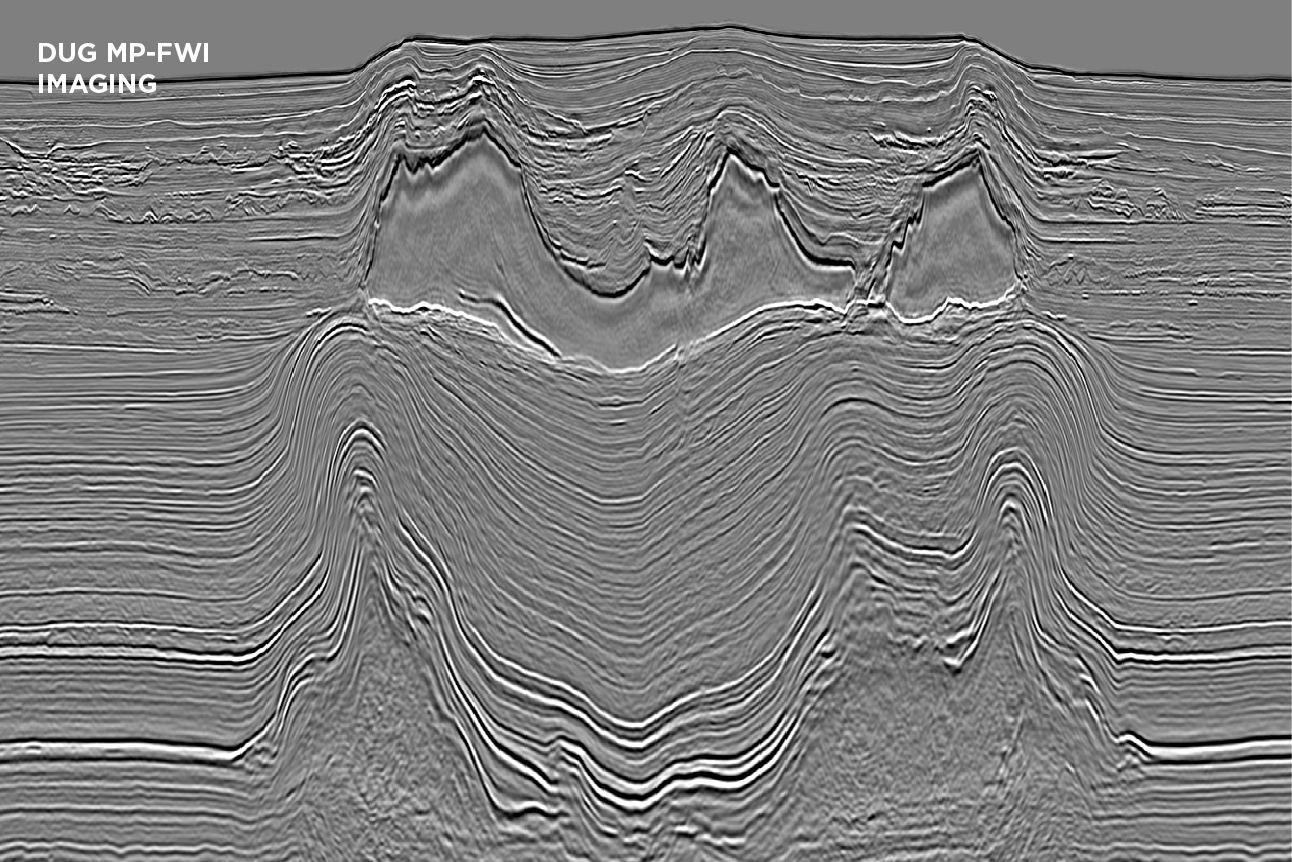
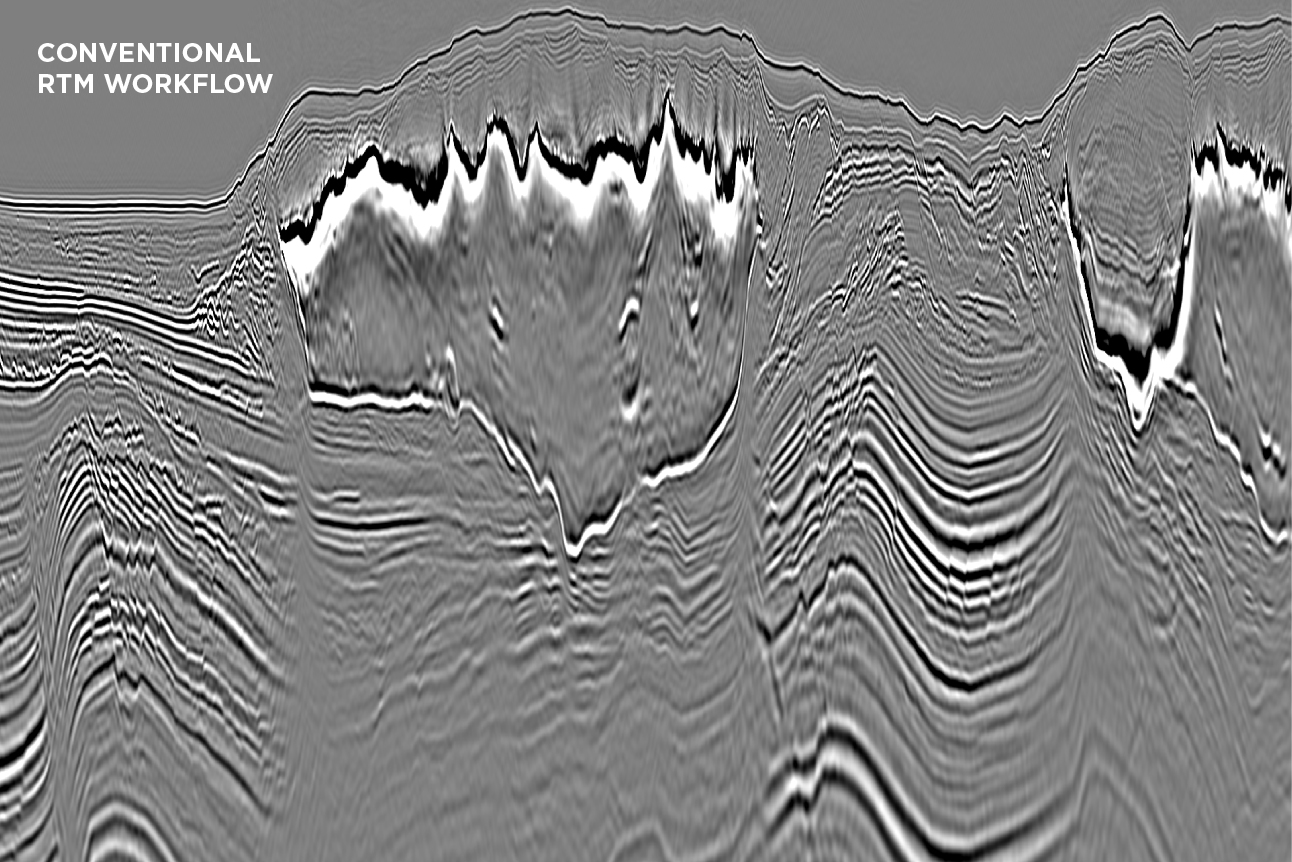
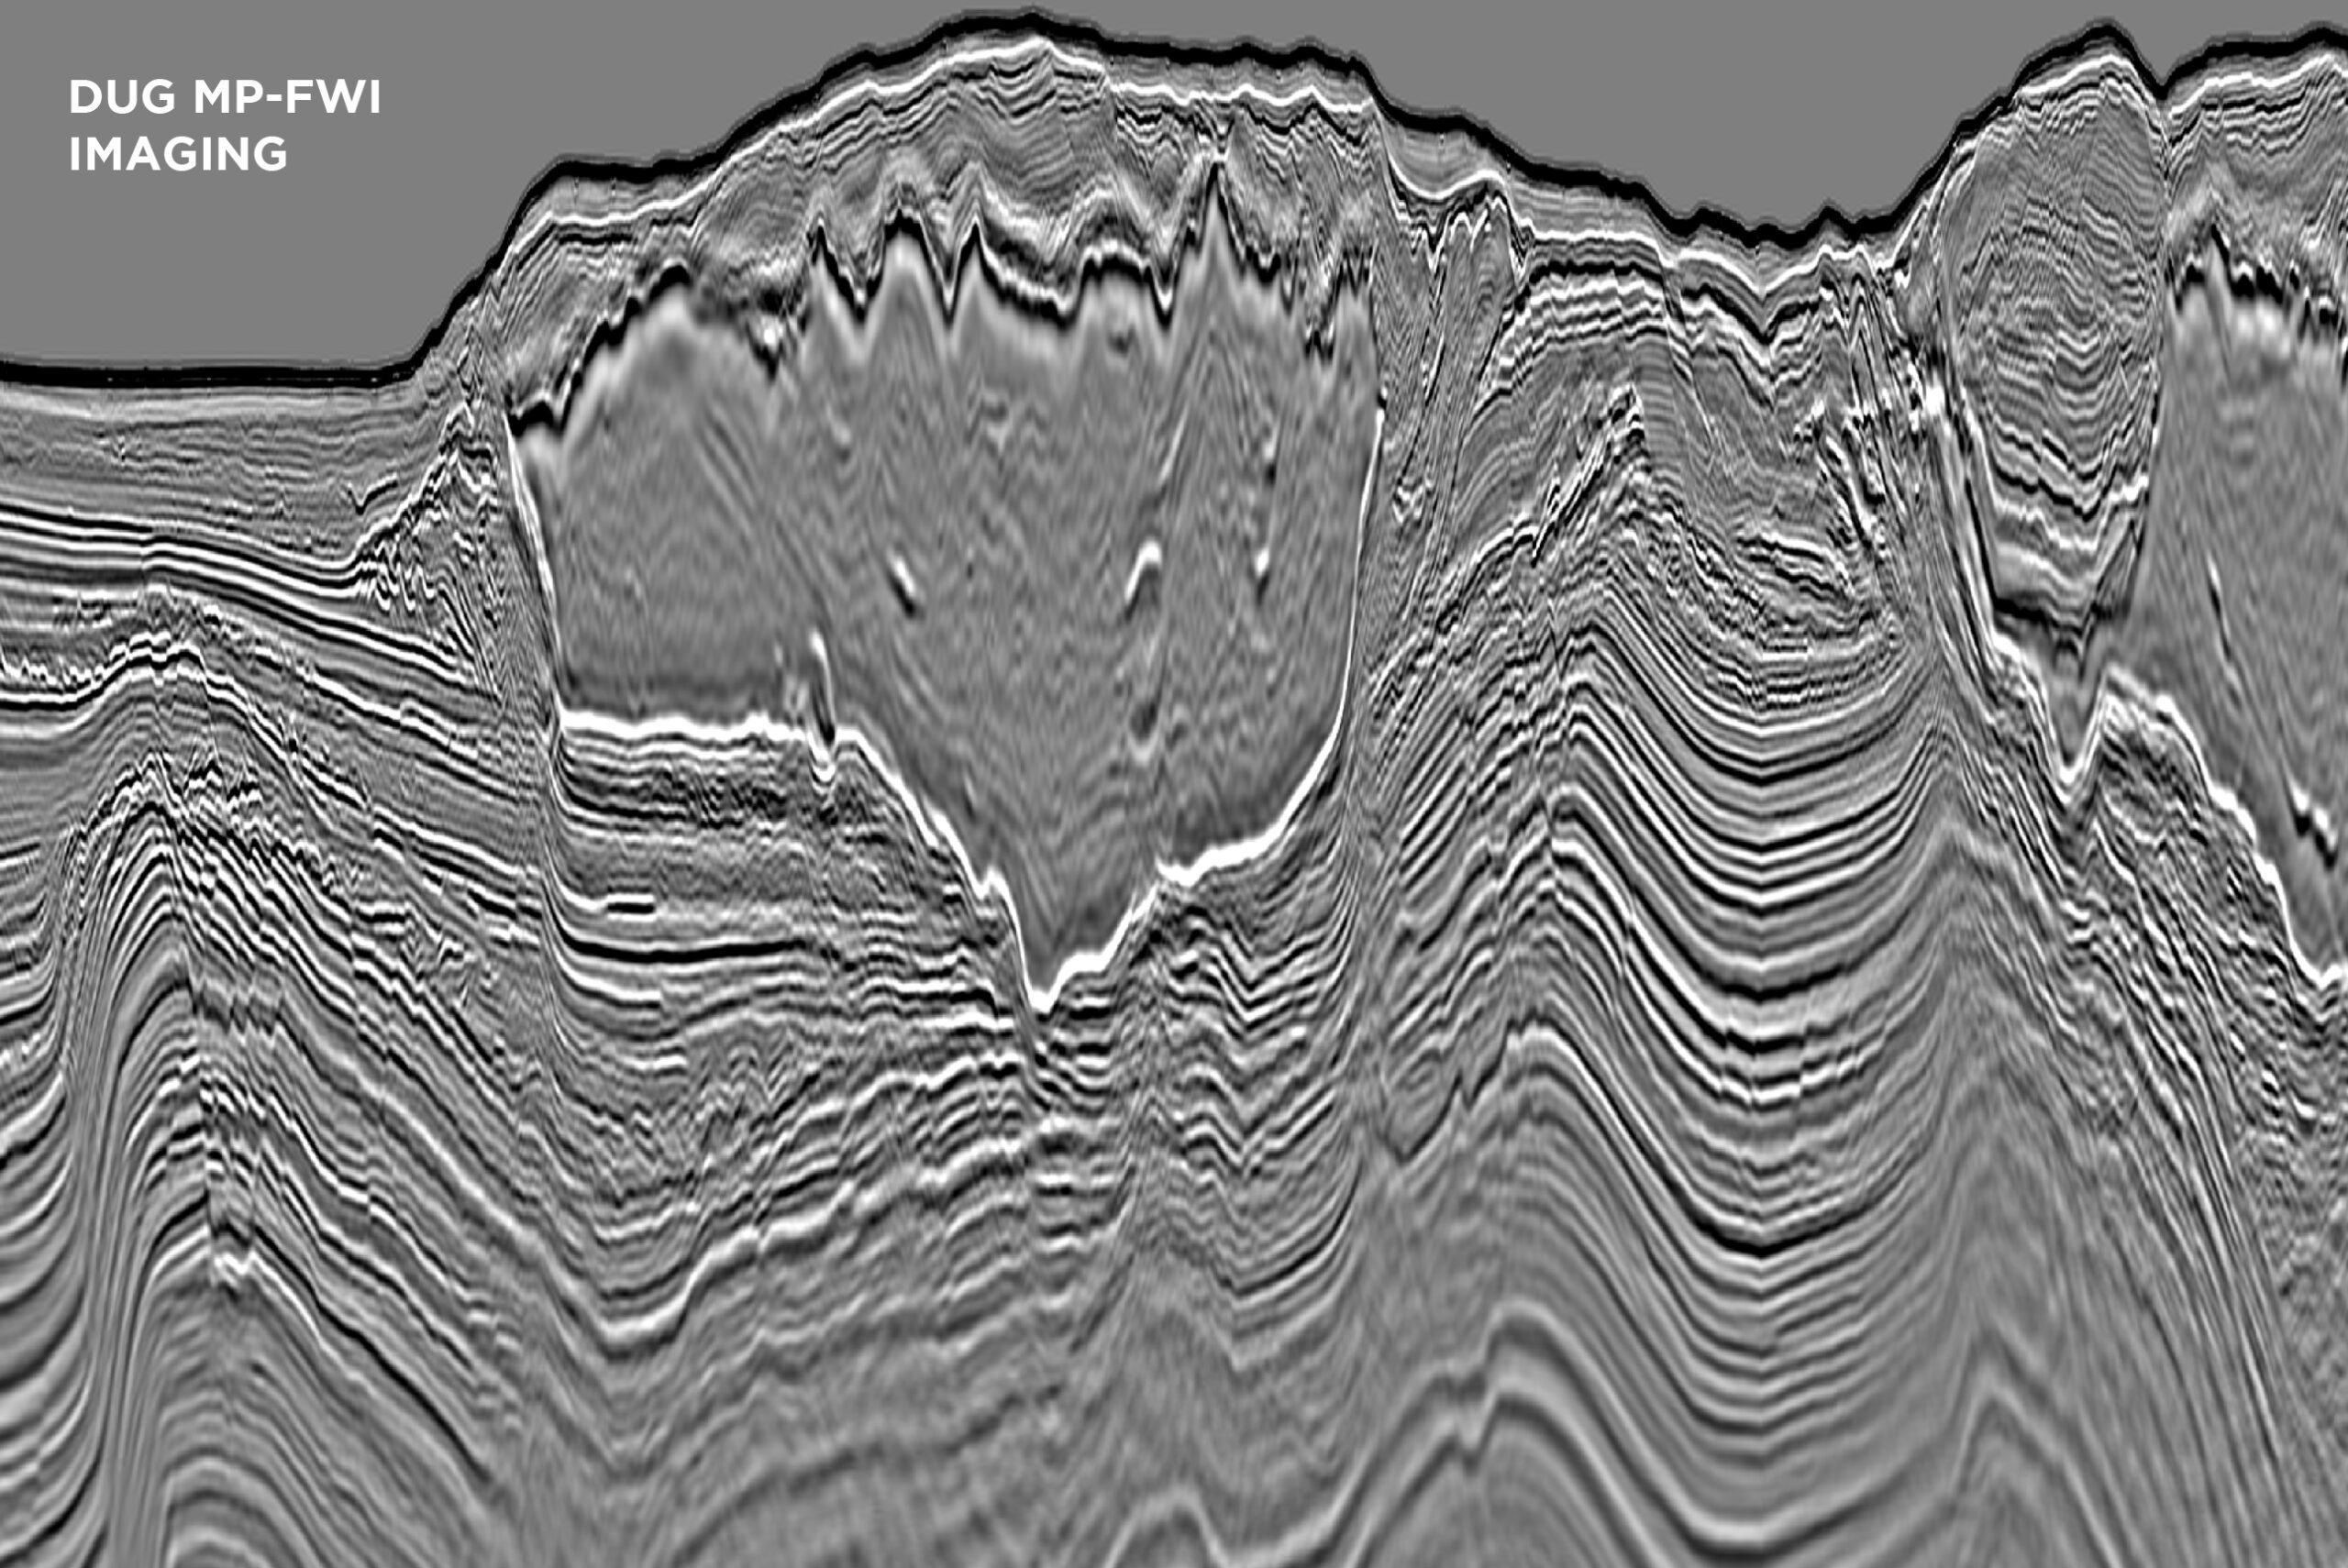
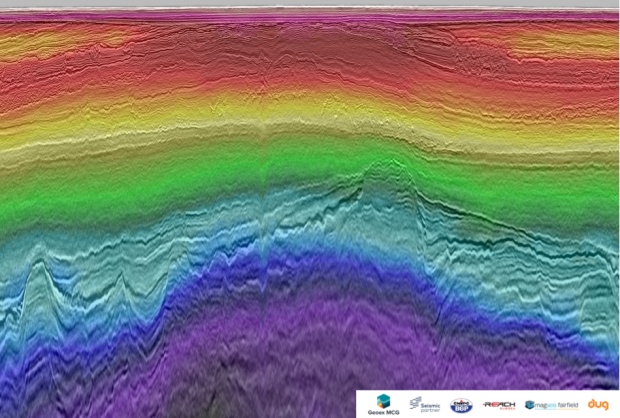
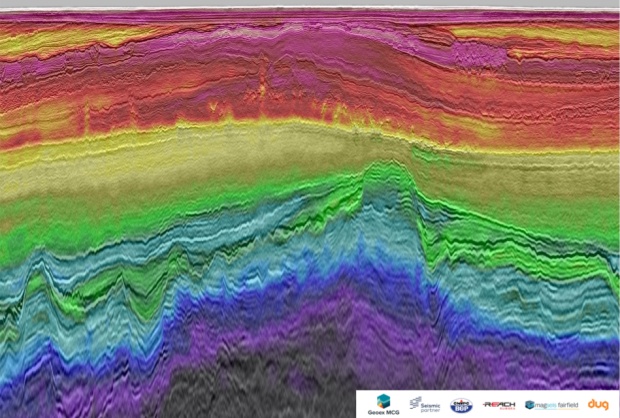
A comparison between imaging results in a complex salt environment, offshore Gulf of Mexico. Conventional reverse time migration (RTM), after pre-processing & regularisation versus DUG MP-FWI Imaging result using field-data input. Superior resolution. Superior imaging. (Data courtesy of Shell)
Shallow-water environments are notoriously challenging for conventional processing workflows due to the presence of strong, short-period multiples that obscure primary signal. In this shallow-water dataset from the Barents Sea, DUG MP-FWI Imaging generated a high-resolution image up to 110 Hz. (Data courtesy of Aker BP)
A comparison of results from a hybrid (towed-streamer and OBN) dataset from the Norwegian North Sea. (Data courtesy of Seismic Partner and Geoex MCG)
Obtain unrivalled results faster with DUG Multi-parameter FWI (MP-FWI) Imaging technology. Simultaneous model building and high-frequency, least-squares imaging deliver accurate, high-resolution Earth models using field-data input—without the many time-consuming, subjective, serial steps of a conventional processing and imaging workflow. At high frequency, this revolutionary approach provides reflectivity images for both structural and quantitative interpretation, including angle stacks for AVA analysis.
FWI inverts for high-resolution earth models using the entire seismic wavefield. It is an integral part of our depth model-building strategies for conventional imaging workflows.
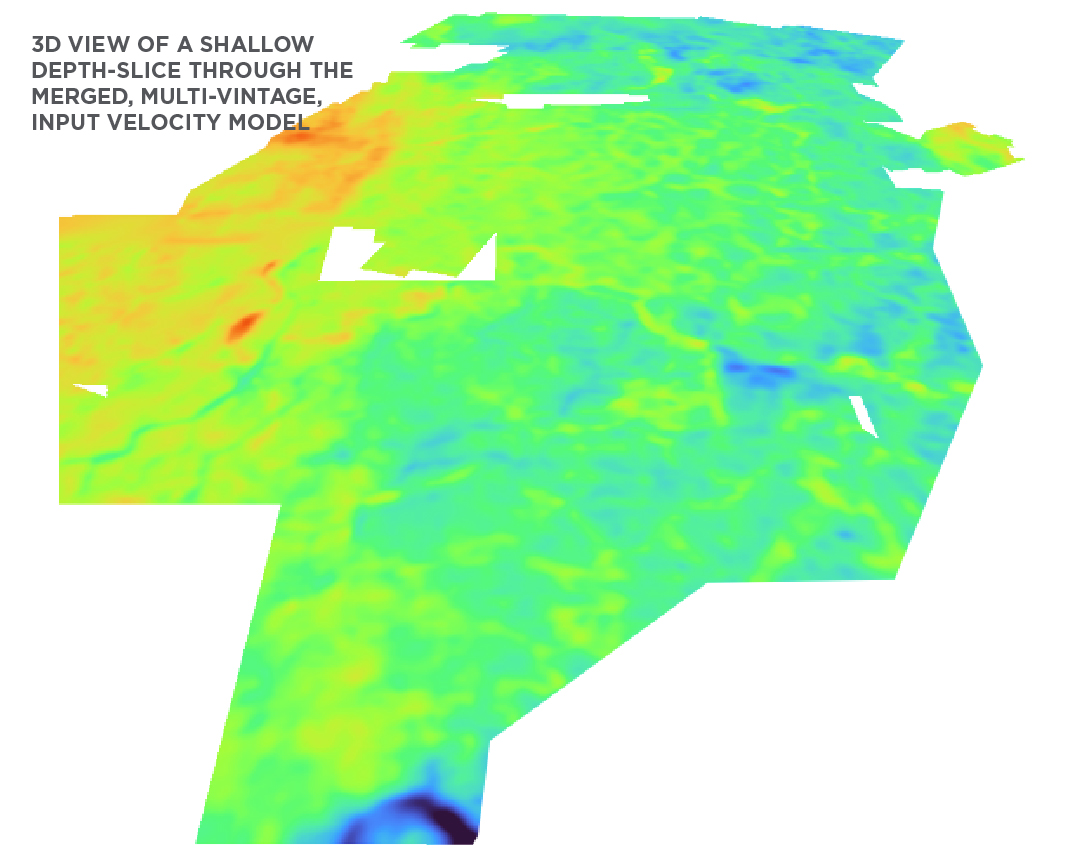
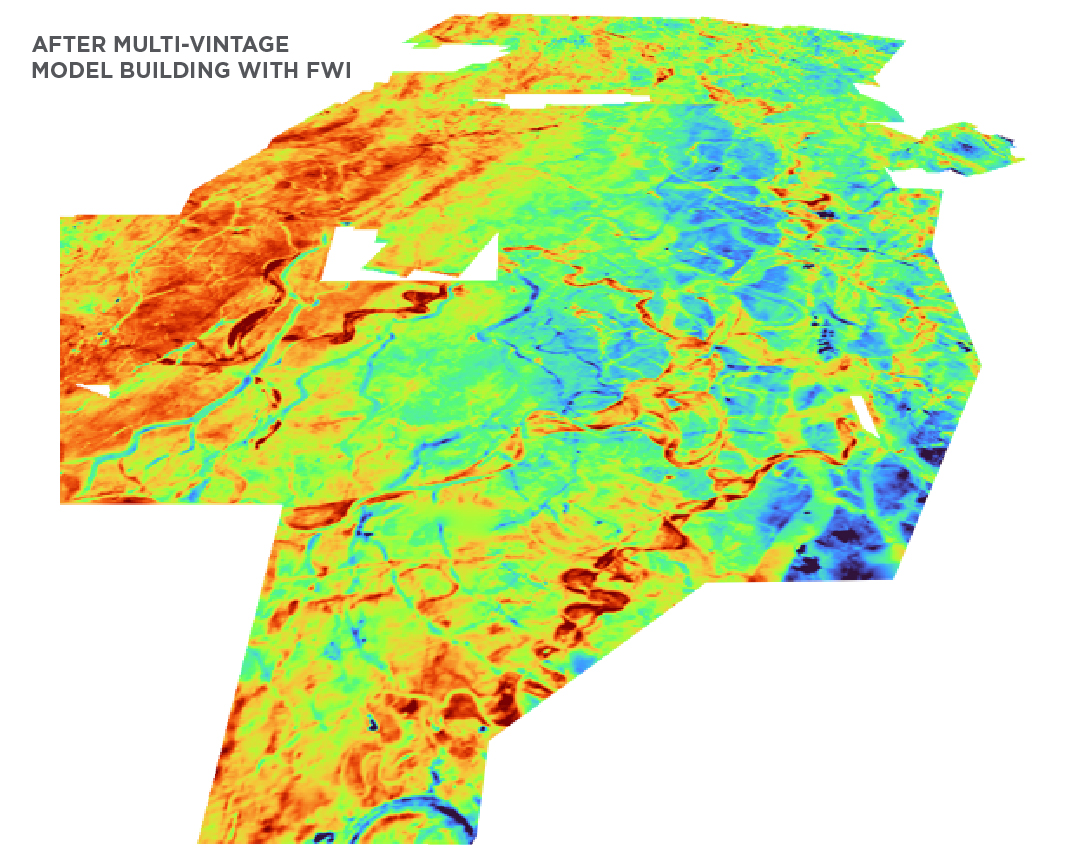
A JV project between TGS and DUG, the “Peninsular Malaysia Mega Merge 3D” involved 39 different surveys (including 3 OBC surveys). With data vintages from 1989 to 2014 the combined area was over 17,000 square kilometres. The high-resolution velocity model was built up to a maximum frequency of 35 Hz.
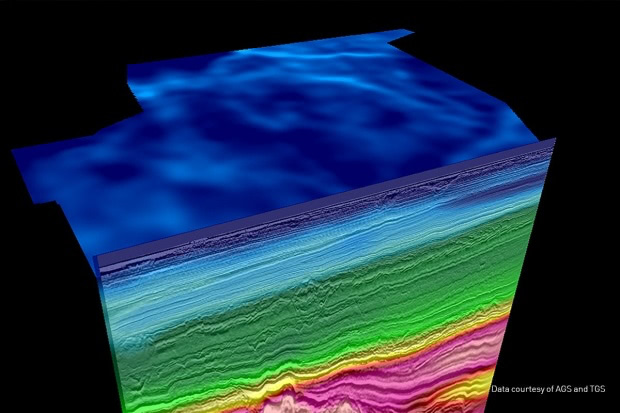
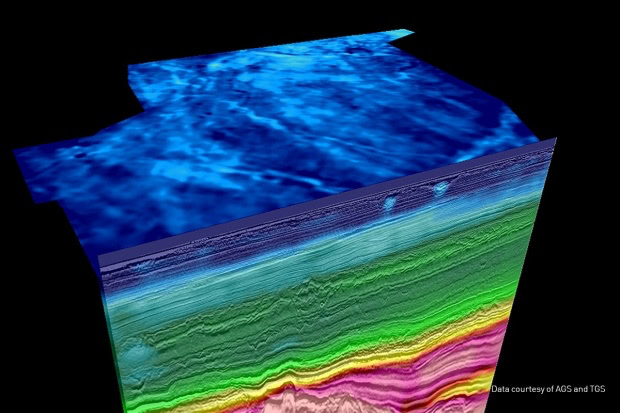
Starting velocity model and final model after FWI. Depth slice and inline with migrated stack overlaid with the respective velocity model. In this OBN example the shallow channels are well resolved after FWI, correcting the imaging distortions at depth. (Data courtesy of Carbon Transition and TGS)
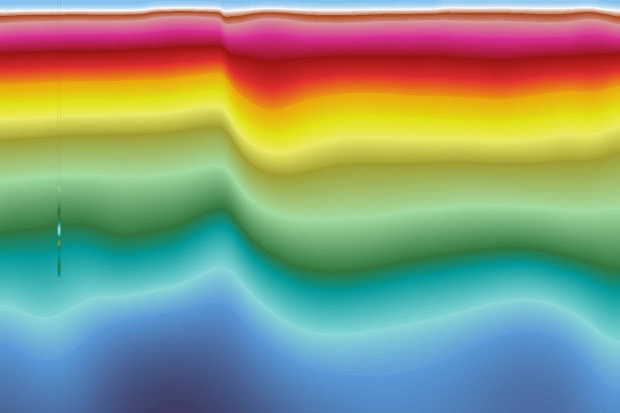
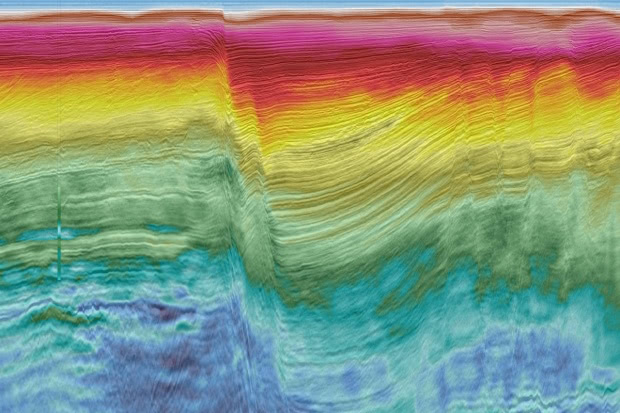
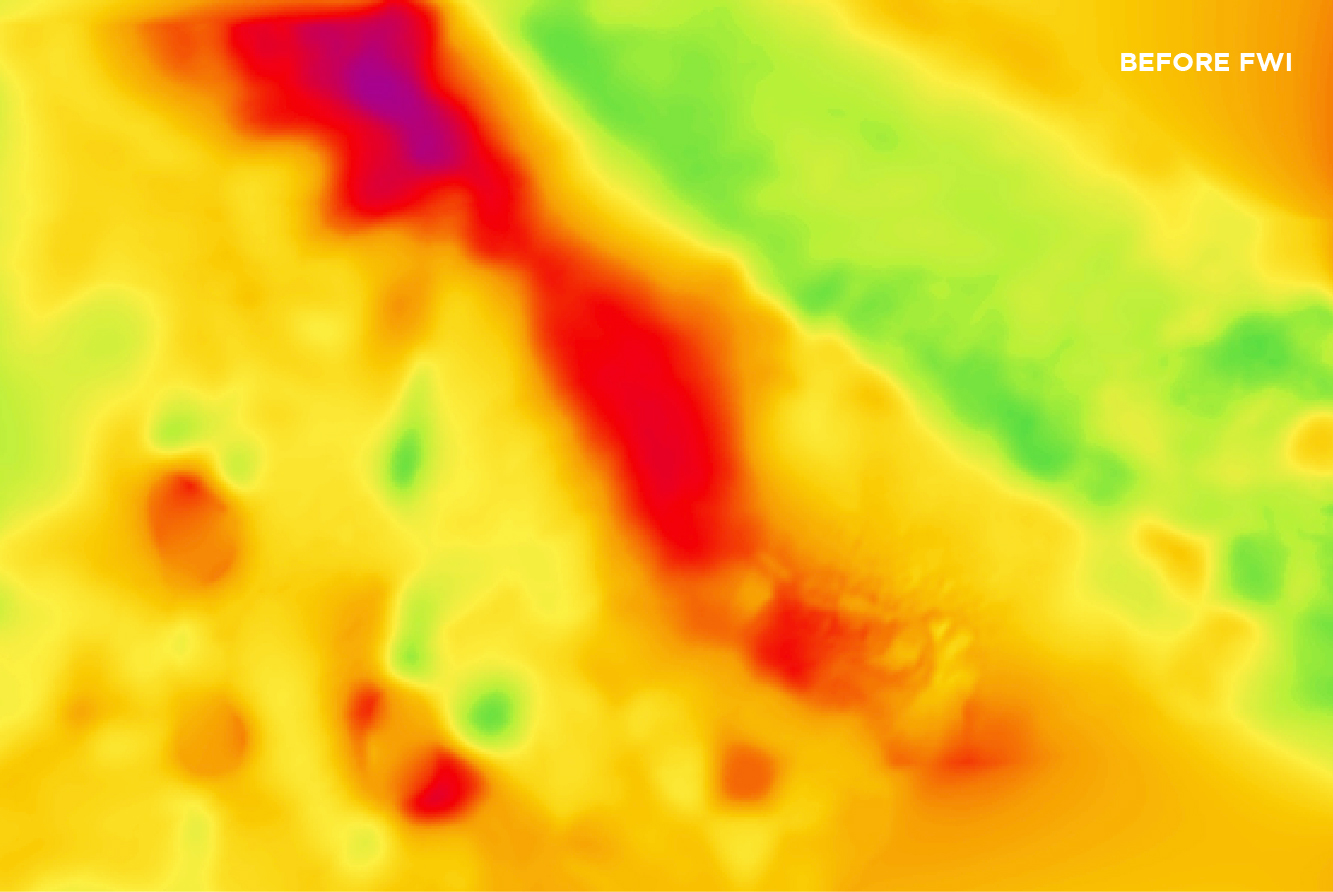
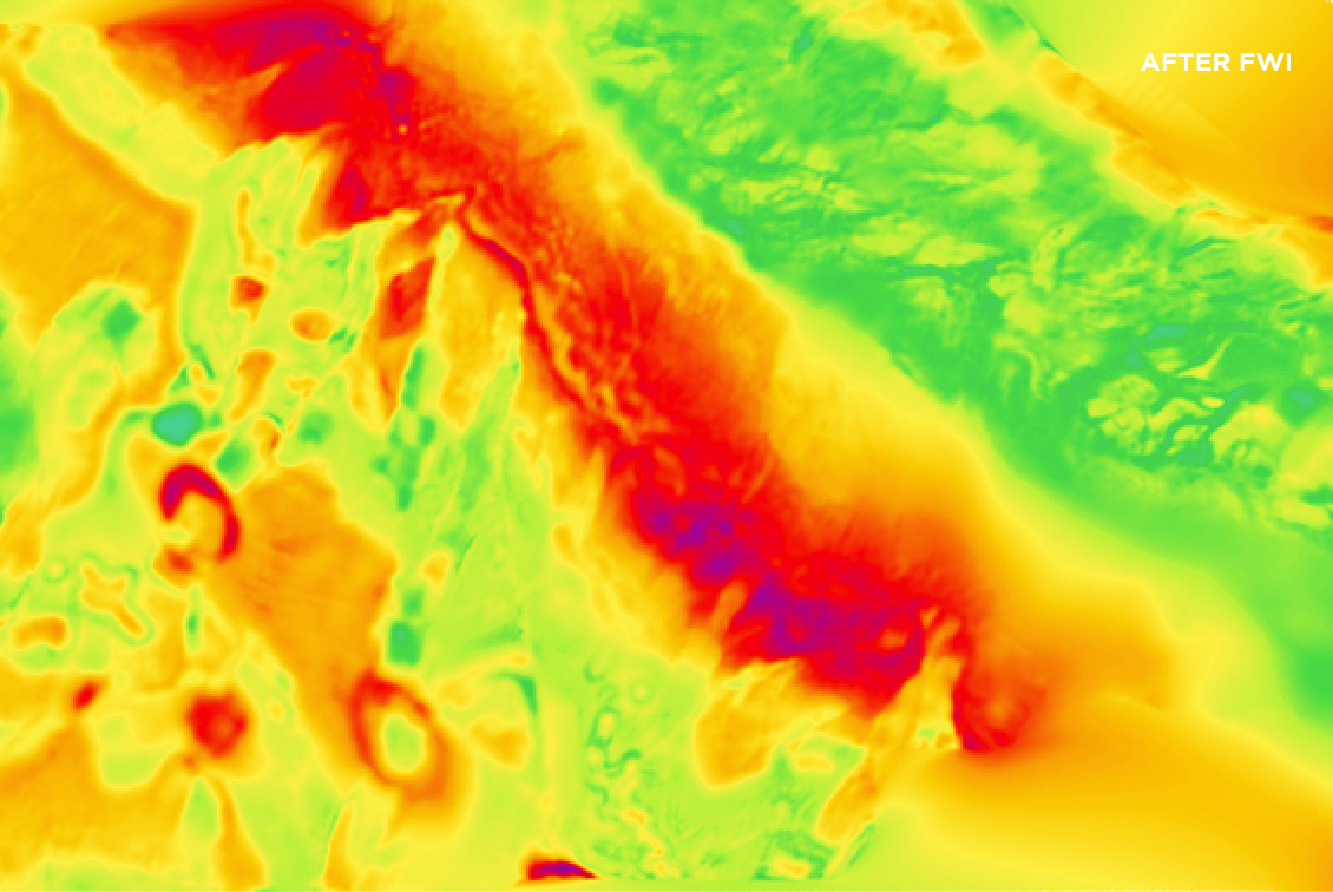
Before and after FWI. Smooth starting velocity model prior to FWI (left) and after FWI, co-rendered with the seismic data (right). (Data courtesy of Shell NZ).
Shallow depth slice of the velocity model prior to FWI versus shallow depth slice of the velocity model after FWI highlighting significant short wavelength detail.
FWI using both high-resolution streamer data and sparse OBN data. Velocity updates beyond 5 km depth are achieved thanks to the long offset diving wave penetration of the OBN data. (LumiSeisTM data courtesy of MCG)
Designed for geoscience, not computer science. Backed by some of the greenest HPC on the planet.
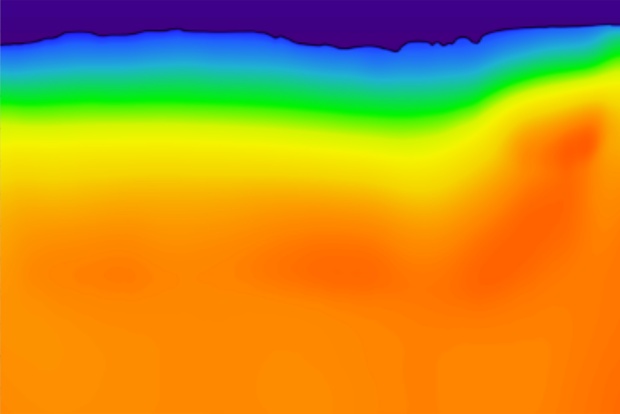
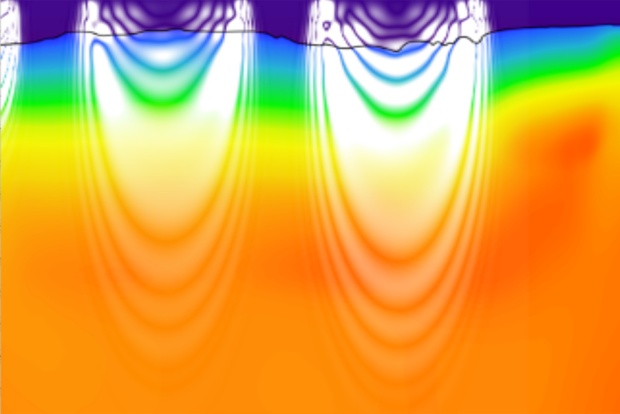
Diving wave penetration QC. The white “bananas” demonstrate the maximum depth of update expected from diving wave FWI.
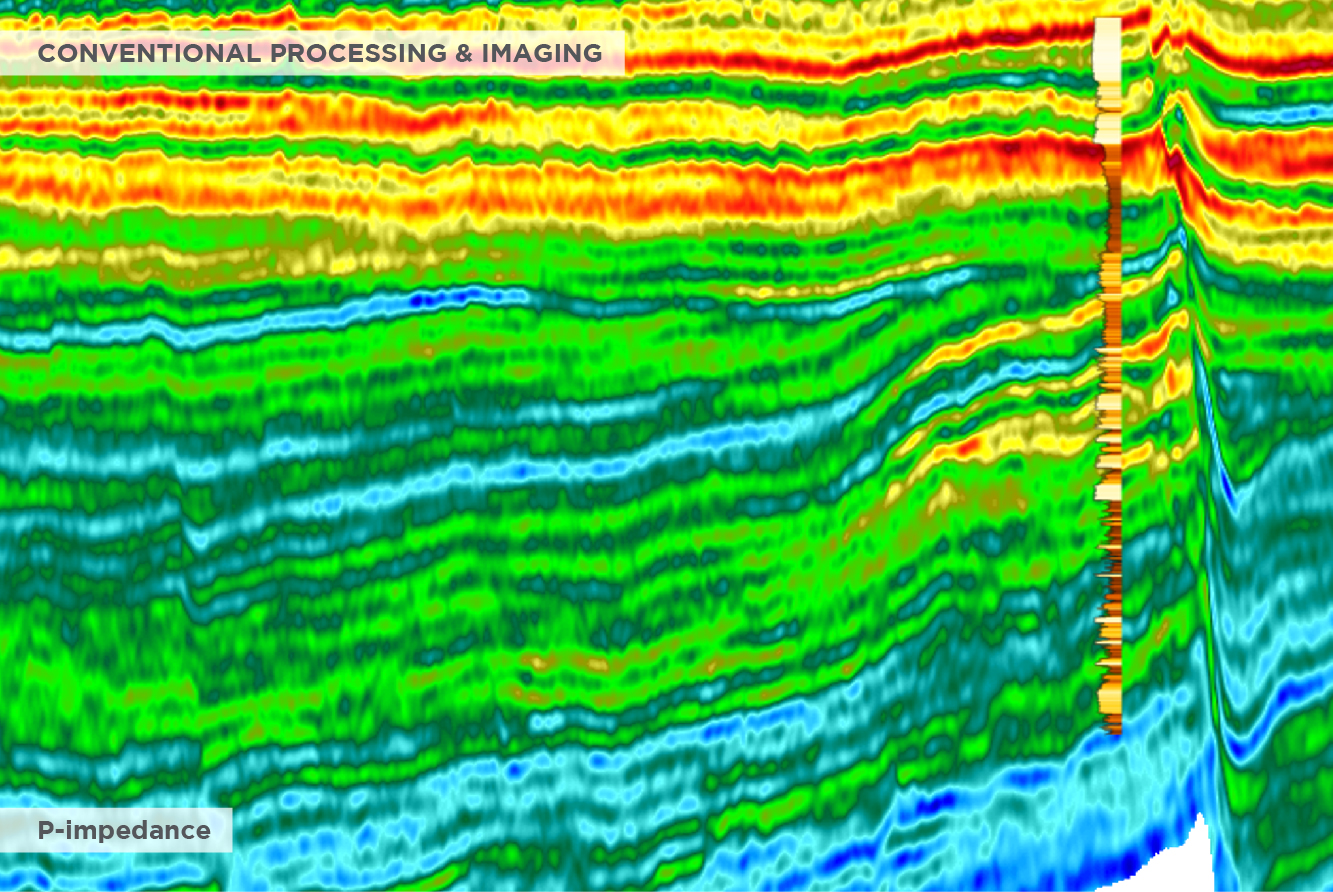
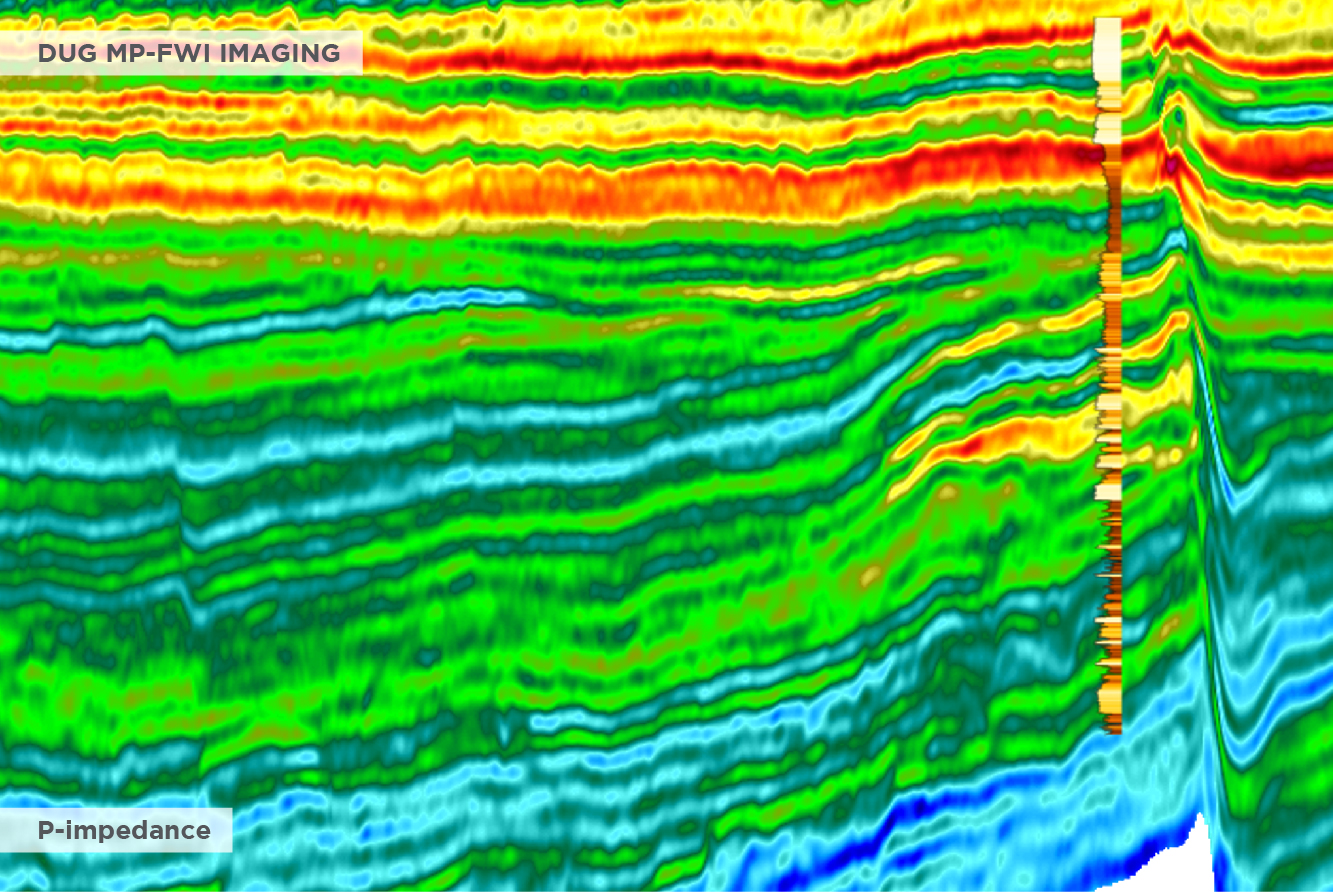
P-impedance. Warmer colours represent lower values. Simultaneous AVA inversion results using pre-stack reflectivity inputs from conventional processing and imaging (time pre-processing and Kirchhoff depth migrations) versus DUG MP-FWI Imaging using field-data input. (BEX MC3D data courtesy of Multi-Client Resources)
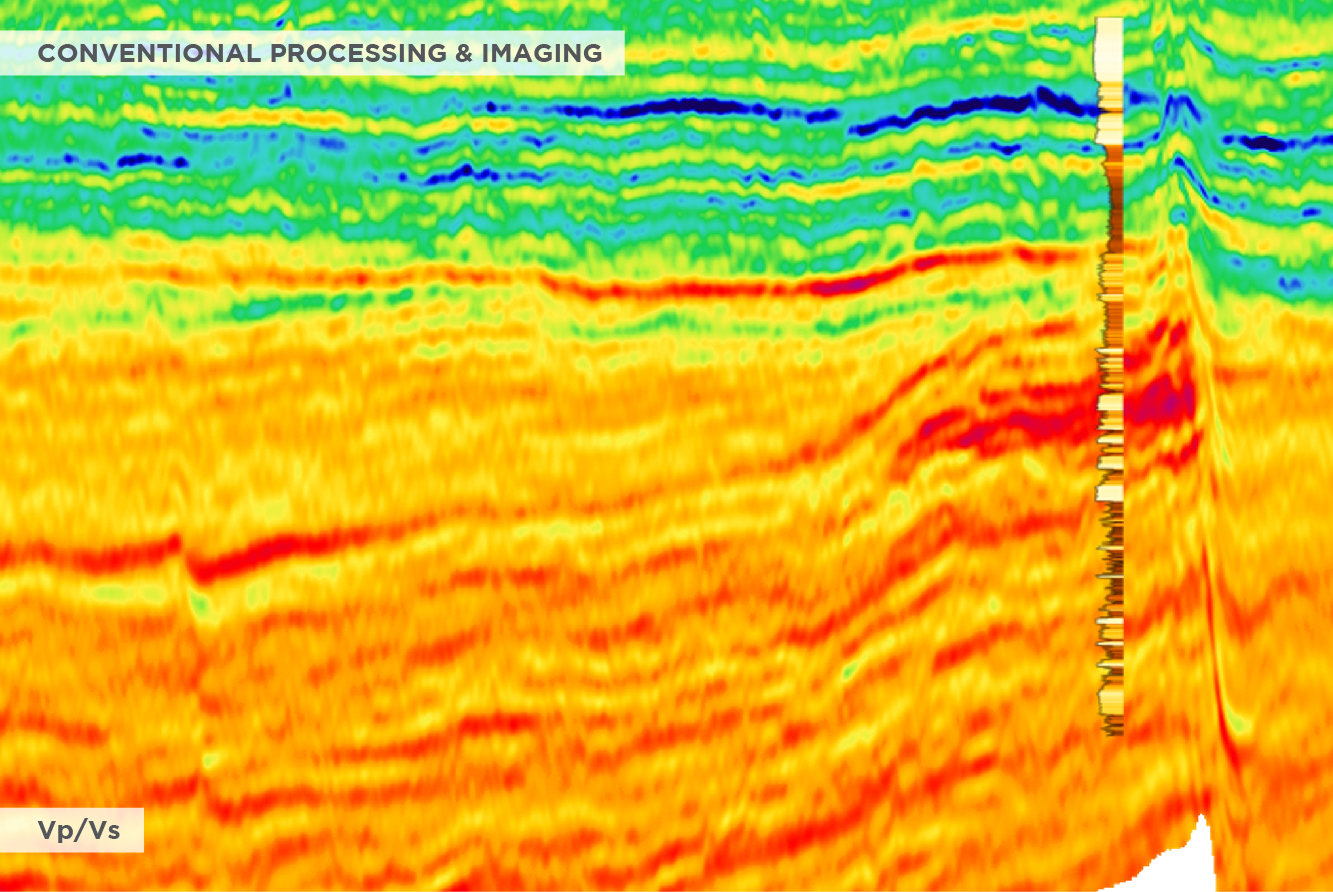
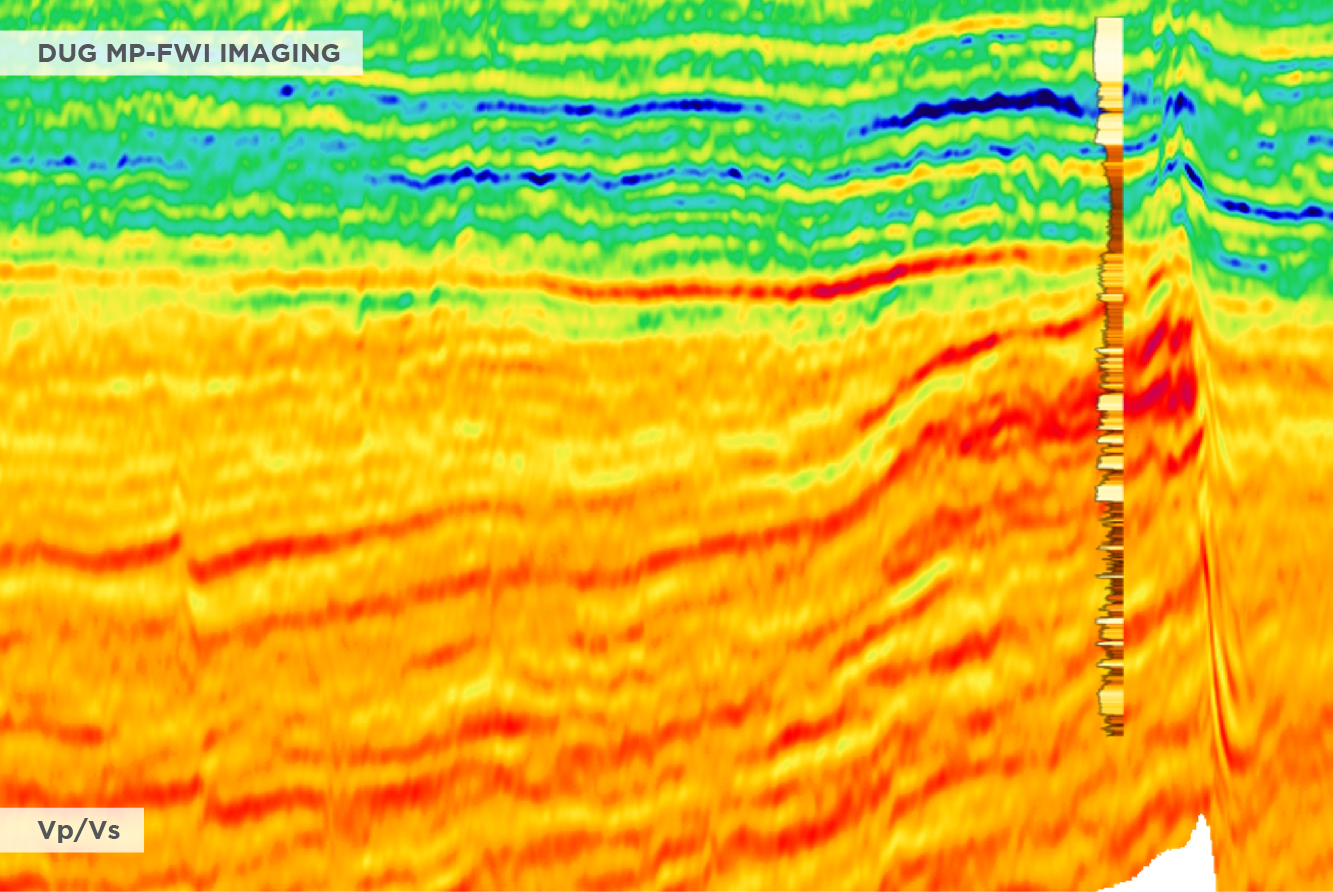
Vp/Vs ratio. Warmer colours represent lower values. Simultaneous AVA inversion results using pre-stack reflectivity inputs from conventional processing and imaging (time pre-processing and Kirchhoff depth migrations) versus DUG MP-FWI Imaging using field-data input. (BEX MC3D data courtesy of Multi-Client Resources)
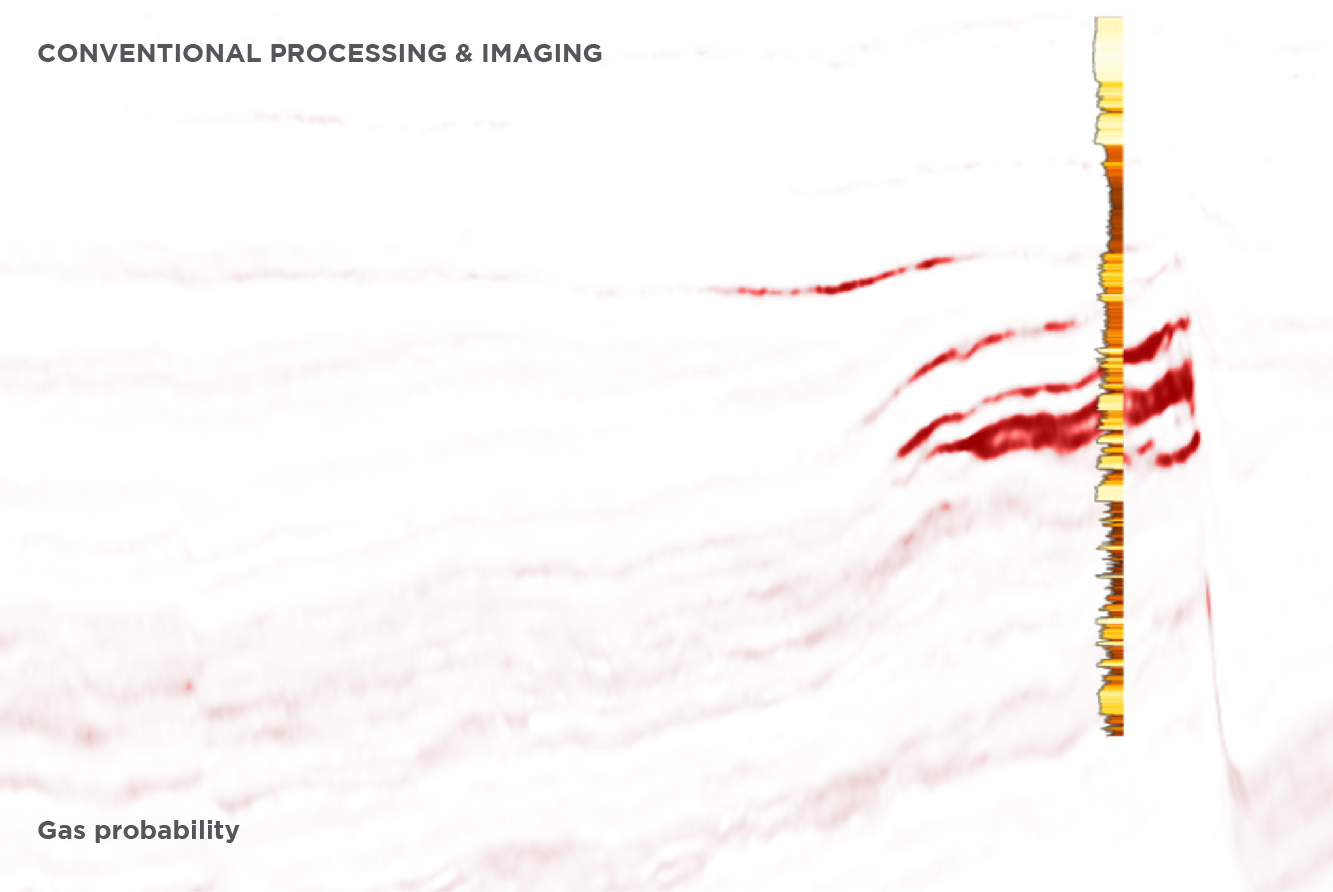
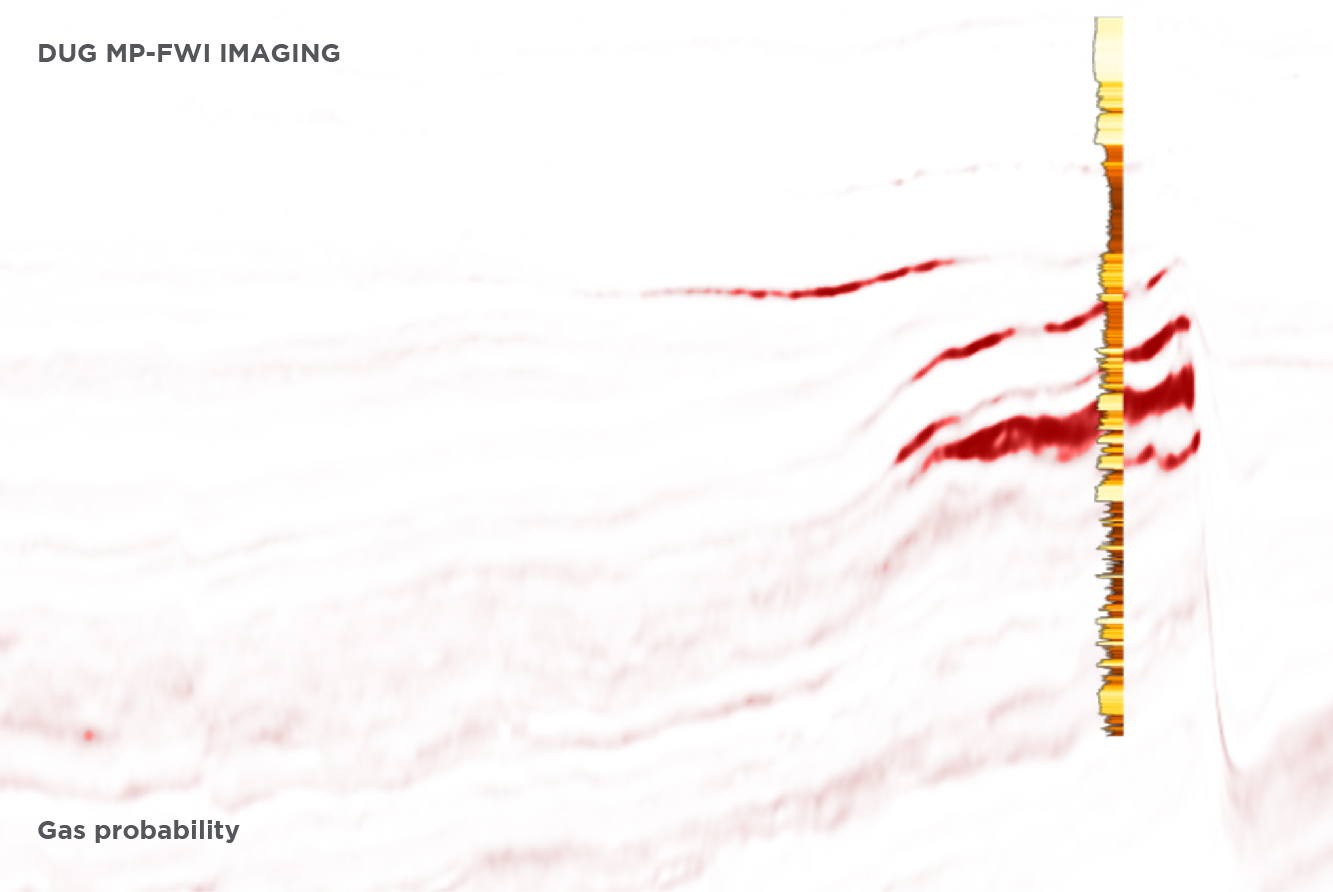
Gas probability after fluid and lithology prediction using a Bayesian classification framework. High probability is shown in red. Qualitatively the results are very similar—but note the vastly different workflows to get to each result. (BEX MC3D data courtesy of Multi-Client Resources)
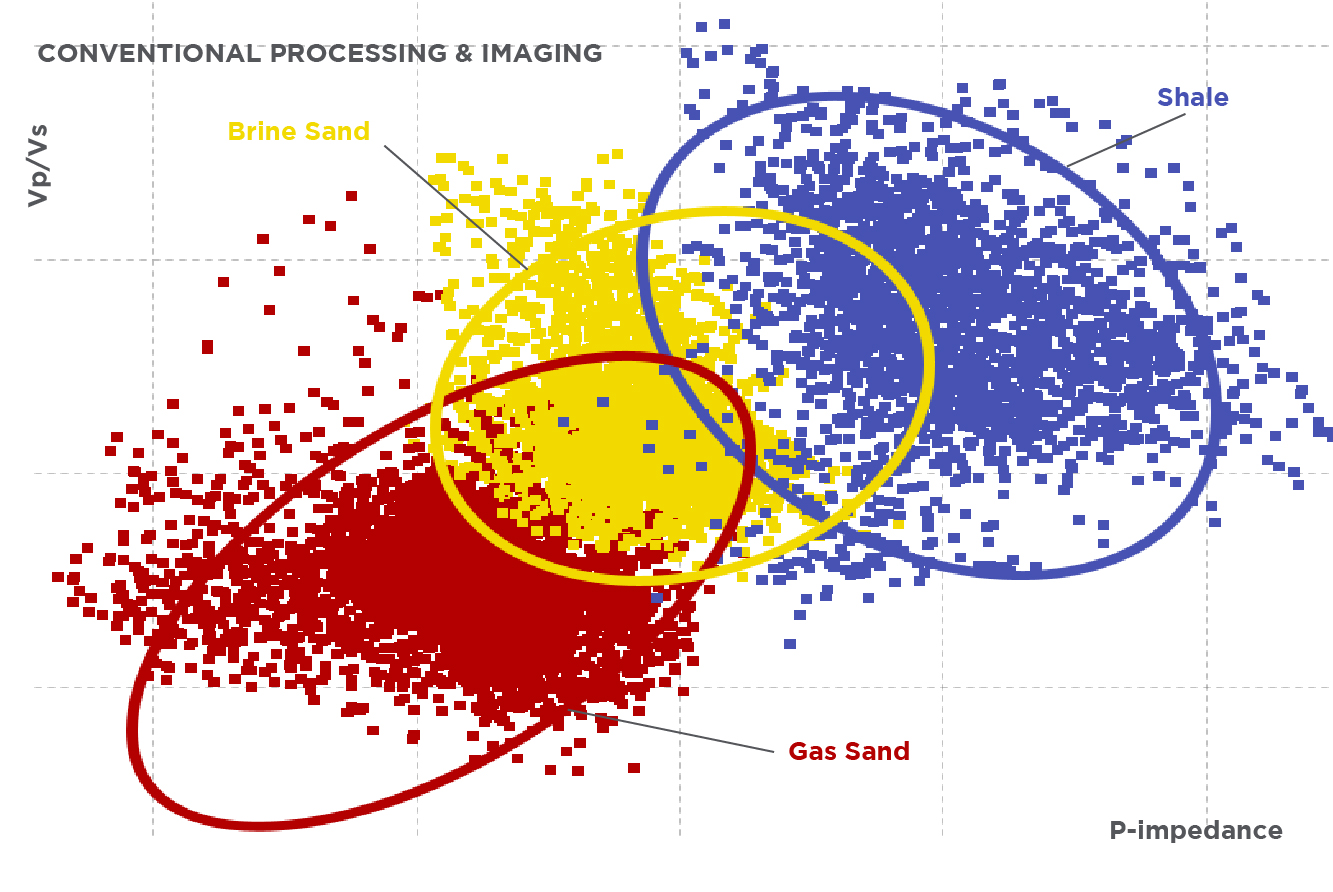
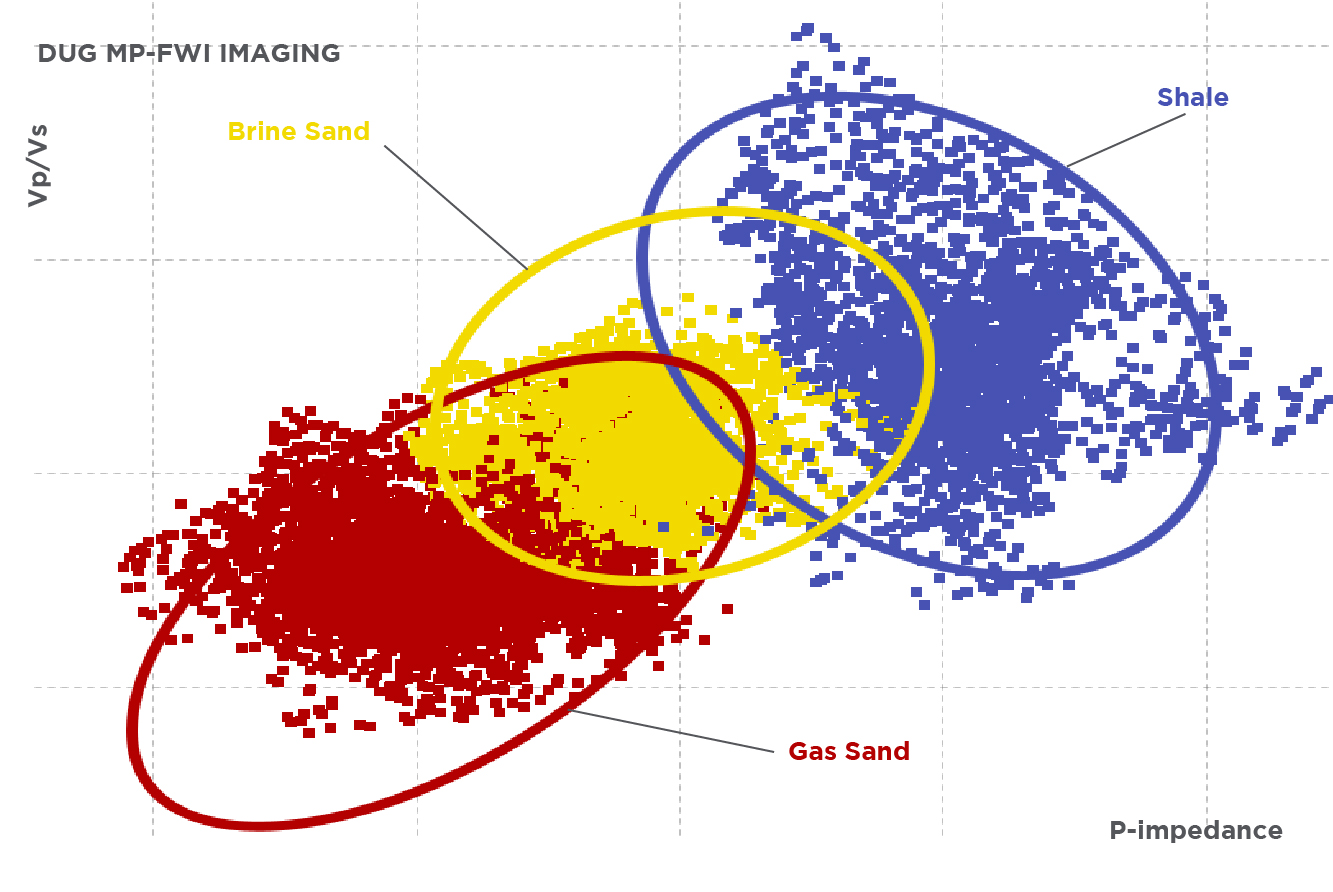
Crossplots (prepared in exactly the same way) for each respective set of inverted rock properties. PDFs of modelled fluid and lithology combinations are also depicted. Note the DUG MP-FWI Imaging results have produced less scatter (or higher signal-to-noise ratio) which translates to less uncertainty. (BEX MC3D data courtesy of Multi-Client Resources)
Quantitative interpretation requires true amplitudes and high signal-to-noise ratio. DUG MP-FWI Imaging delivers superior pre-stack amplitude vs angle outputs for lithology and fluid prediction.